How Pest Control Businesses Capture More of the Demand Already in Their Market
Demand for pest control exists. Property owners search for termite inspections, rodent control, and emergency bedbug treatments. They hire whoever responds first.
The difference between a full route and stagnant growth is not the efficacy of the pesticide. It is capture infrastructure. Most pest control companies lose half their demand to missed calls and slow quotes.
Growth in this field comes from visibility during high-urgency searches, immediate response to inquiries, and systematic follow-up. The companies that capture more demand have better infrastructure.
Common Demand Leaks for Pest Control
Missed calls during field service
Technicians are on jobs while new clients call. Voicemail reduces booking by 75%.
After-hours emergency infestations
Pest sightings at night cause high urgency. Companies without immediate response lose these urgent jobs.
No pest-specific targeting
Searches for "termite control for builders" or "organic ant treatment" are lost in generic ads.
Slow inspection scheduling
A customer with a pest problem will book with whoever schedules an inspection within hours. Delays lose most opportunities.
Buying Moments for Pest Control
Buying Moments for pest control are situations where a property owner has decided to take action and is comparing options:
Active pest sighting
Seeing a roach, rodent, or termite swarm triggers an immediate search. These are high-intent, ready-to-book situations.
Seasonal surge
As weather changes, pests move indoors. Homeowners search for preventative treatments. They prioritize firms with clear pricing and availability.
Real estate transaction
A required termite or pest inspection for a home sale creates a time-bound, high-urgency booking moment.
Failed DIY attempt
Someone who tried and failed to treat an infestation themselves searches for professional help. They are ready to commit.
How the System Captures Demand
The system captures pest control demand through four layers:
Visibility
Ads placed for high-intent searches: "pest control near me", "termite treatment [city]", "exterminator for mice". Listings optimized for specific pests and urgency.
Capture
Calls answered immediately, 24/7. Inspection requests responded to within minutes. Every inquiry is captured, not lost to voicemail.
Conversion
AI answering system schedules inspections directly. Follow-up sequences for clients who inquired but did not book. Buying Moments are converted into jobs.
Protection
Continuous monitoring of coverage and competitor activity. Monthly reviews show where demand is captured and where it is being lost.
What You See
What you see with this system:
- •Which searches your company appears for and which you do not cover
- •How many calls were answered versus missed
- •Where website visitors come from and what they searched for
- •Which inquiries converted to jobs and which did not
- •What is being improved next and why
Semantic Demand Matrix for Pest Control
Our system doesn't just target "keywords." It maps the technical architecture of Pest Control demand to capture the specific jargon and high-intent terminology used by the most valuable prospects in your market.
* This matrix represents a live semantic map used by our Pest Control deployments to prevent demand leakage. By capturing the full technical spectrum of your market, we ensure your brand appears when high-ticket buyers search for specific solutions, not just generic service categories.
Real Results for Pest Control
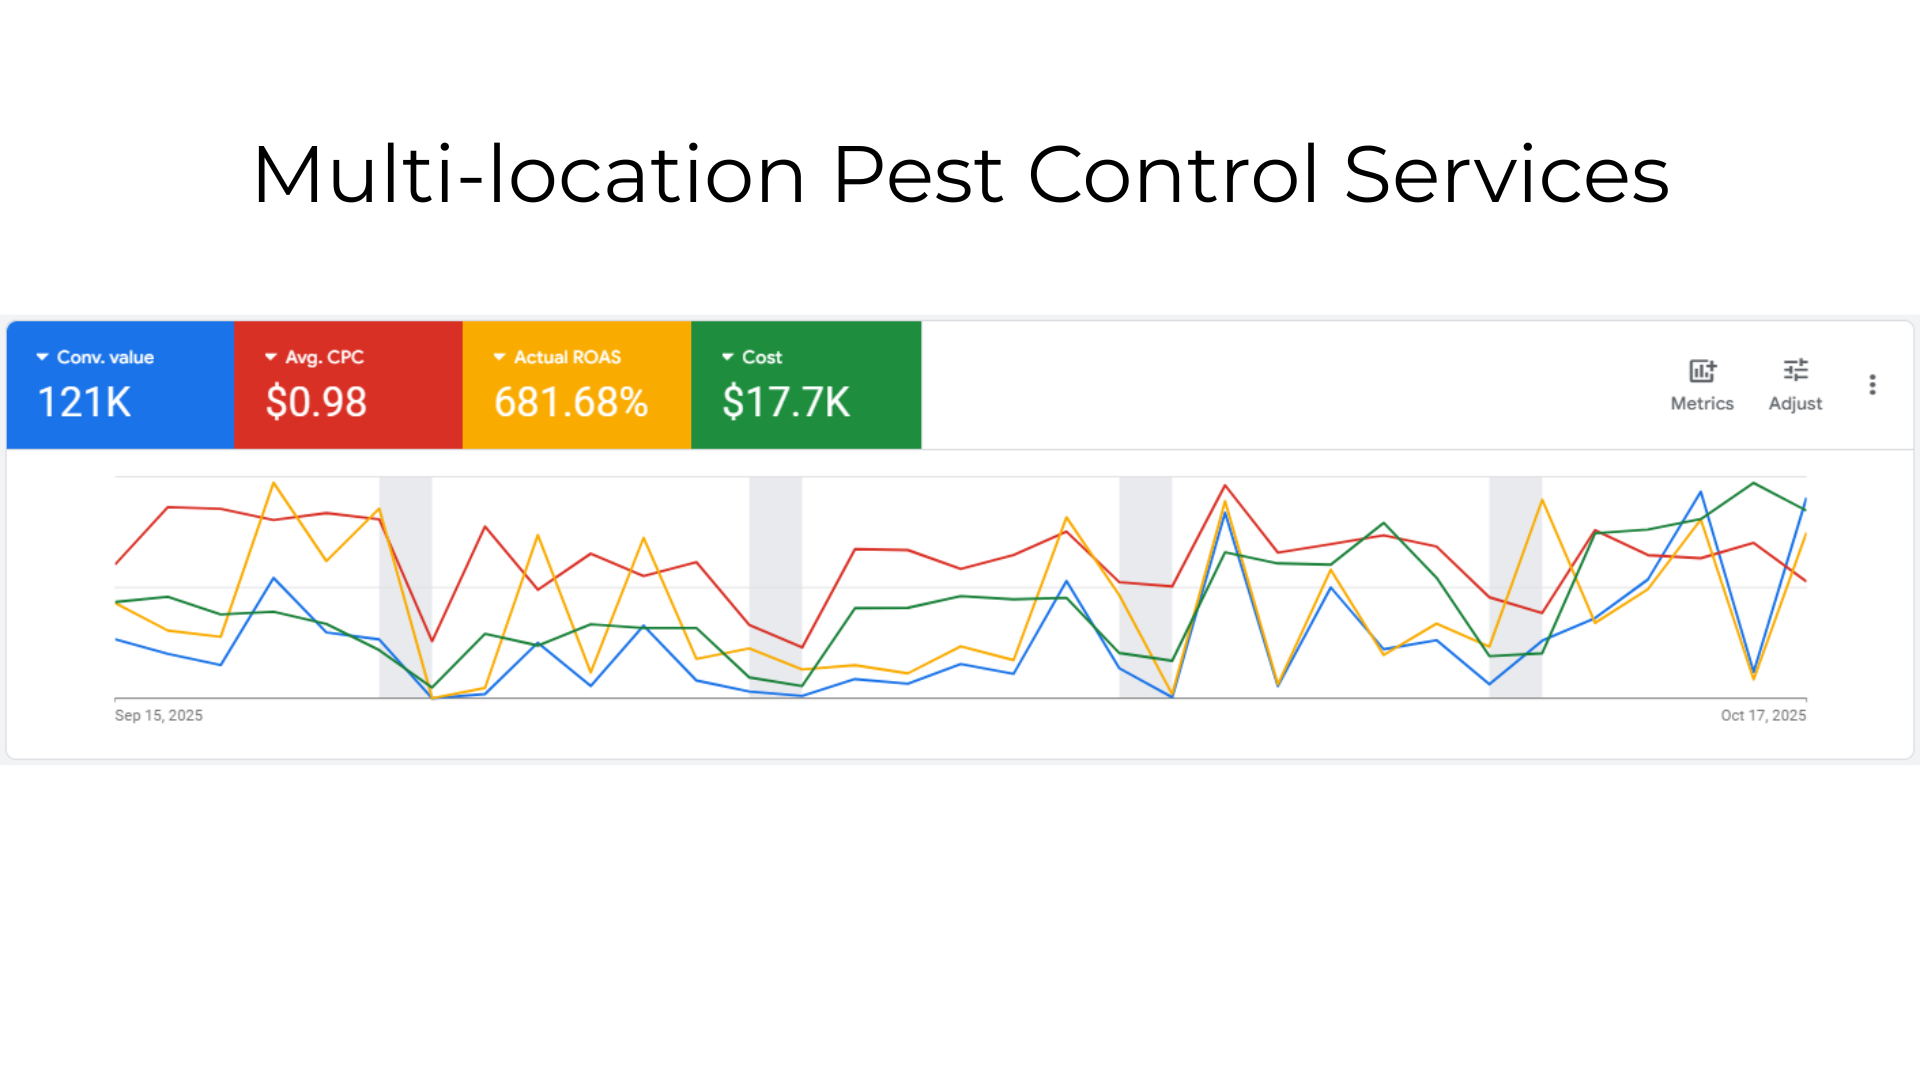
Performance Summary
"Seasonal keyword bidding and radius targeting doubled monthly contracts."
Results are specific to this business and market. Your results will vary based on your industry, competition, and implementation quality.
Important Notes
Key Metrics Breakdown
System Deployments
System deployments for pest control have shown:
A pest control firm captured $42.5K in contract value through pest-specific search campaigns and immediate inspection scheduling.
AI answering recovered emergency calls made after-hours, increasing booked inspections by 38%.
Service-specific ad campaigns for termites reduced cost-per-lead and increased high-value contracts.
These examples reflect what occurred in specific situations for specific businesses. They are not guarantees, projections, or promises of results. Max Digital Edge guarantees system visibility and coverage accountability - not specific performance outcomes.
Who This Is For
Good fit
- •Pest control companies with inconsistent routes despite strong service results
- •Businesses losing jobs to national competitors with 24/7 call centers
- •Owners wanting visibility into where high-value demand is leaking
Not a fit
- •Companies expecting guaranteed jobs without responsive follow-up
- •Owners unwilling to schedule inspections or answer inquiries promptly
- •Businesses looking for marketing hype instead of systematic infrastructure
Common Questions
How we help Pest Control capture demand
Demand for pest control exists right now in your market. Prospects are searching for emergency extermination, termite inspections, and preventive treatments. You lose opportunities when coverage gaps prevent visibility during these high-intent searches, or when conversion leakage lets competitors capture demand you paid to generate.
Fix Google Ads
Stop wasted spend on broad pest keywords and restore tracking for emergency extermination and inspection searches.
Learn moreBuying Moment Coverage™
Own visibility across infestation emergencies, seasonal prevention, and inspection deadline moments.
Learn moreAI Answering & Booking
Protect speed-to-lead for emergency calls and same-day service requests.
Learn moreBuying-Moment Landing Pages
Convert pest control searches with pages built for emergency situations and same-day availability.
Learn morePricing
See setup and monthly costs for the demand capture system built for pest control businesses.
Learn moreContact
Request a coverage review to identify where pest control demand is leaking in your market.
Learn moreService Coverage
Pest Control Businesses Across the United States
Max Digital Edge builds demand capture infrastructure for Pest Control businesses in every major US market. Select your city to see market-specific demand capture insights.
Request a Coverage Review
See where your demand is leaking. Coverage starts immediately.
Request Coverage Review